GLOBAL Clinical Study Demonstrates Value of Panomics-Based Drug Discovery Approach
Integrating imaging, multiomic technologies, and big data uncovers novel diagnostic and therapeutic targets for common chronic diseases.

GLOBAL Clinical Study Demonstrates Value of Panomics-Based Drug Discovery Approach
Introduction
Szilard Voros, MD became interested in pharmaceutical research and development and entrepreneurial innovation while in cardiology training at the University of Virginia. He was working on cardiovascular imaging to support the development of ezetimibe, a first-in-class cholesterol-lowering drug. Dr. Voros later moved to the Piedmont Heart Institute in Atlanta, Georgia where he and his team developed novel ways to image and measure disease processes within different organs. They soon initiated separate projects to combine their imaging technologies with genomics, proteomics, and metabolomics, a multiomics approach that they now refer to as panomics.
In early 2011, it became clear to Dr. Voros that integrating all this data could improve the drug discovery and development process, as well as biomarker discovery and development, significantly. It could also provide physicians with information to understand the status of a patient’s disease process and inform the most effective prevention and treatment. He founded the Global Genomics Group (G3) and set off to prove the potential of his panomics approach in a groundbreaking international clinical study, aptly named the Genetic Loci and the Burden of Atherosclerotic Lesions (GLOBAL) study.
Seven years, more than 7000 clinical subjects, and trillions of data points later, Dr. Voros has proved to be a visionary ahead of his time. G3 has succeeded in integrating imaging, panomics, and data analysis into a powerful drug discovery engine. The company has demonstrated the value of its novel approach, with the introduction of a new diagnostics and several drug candidates in development with pharmaceutical partners.
iCommunity spoke with Dr. Voros about how the G3 team developed and fine-tuned its panomics approach, the diagnostic and therapeutic projects that have resulted from it, and how Illumina products and systems are contributing to its success.
Szilard Voros, MD is Founder and Chief Executive Officer of G3.
Q: Why did you start G3?
Szilard Voros (SV): Part of the inspiration for G3 grew out of my frustration as a practicing physician. I was running a prevention cardiology program, seeing patients, and practicing evidence-based, guideline-driven medicine that focused on populations instead of individuals. It was discouraging. I didn’t feel like I was positively impacting the quality of life for many of my patients. It was the 21st century and I felt like there had to be a better way.
During my early academic career, we developed new imaging approaches and technologies to support the identification of novel cardiovascular drugs. They were essentially phenotyping tools that provided specific and quantitative ways to identify and measure different aspects of disease. I founded the company and began to identify how we could integrate imaging data with panomics data, and use advanced analytics to analyze it all.
Q: What challenges did you face in creating G3?
SV: It was an enormous undertaking. Our idea was to bring all the different omics technologies together into a single company, as a single project, for a single objective. At the time, the field was incredibly siloed. There were genomics, proteomics, metabolomics, and metagenomics companies, but they didn’t speak the same language. No one had ever tried to integrate any of those data sets. Conceptually, scientifically, and informatically, there wasn’t a way to take all that information and translate it into a common vocabulary.
Q: What was the biggest unknown in establishing your process?
SV: The biggest unknown was how we were going to integrate the data informatically. We found that the solution was to use different approaches in a parallel, synergistic fashion. For example, we integrate genome-wide association studies (GWAS) with quantitative trait loci (QTL) analysis, and Mendelian randomization with Bayesian network analysis. It’s an integrated approach that changes depending on the analysis objective.
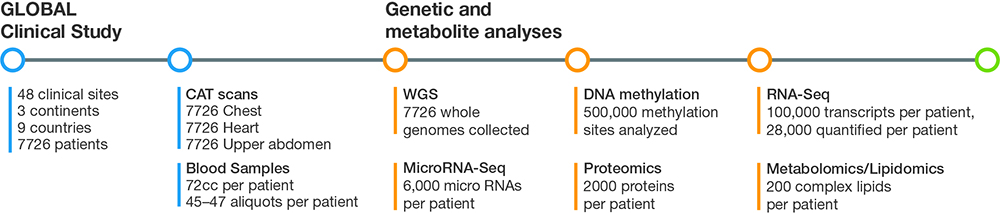
Figure 1: Using a panomics approach, G3 captures and analyzes imaging, genomics, transcriptomics, methylomics, proteomics, and metabolomics/lipidomics data that totals up to several billion data points for each subject in the GLOBAL clinical study.
Q: What diseases are you focusing on?
SV: We’re focusing on multifactorial, multigenic, common chronic diseases such as cardiovascular disease, fatty liver disease, diabetes, osteoporosis, and obesity. These diseases have a direct impact on human longevity. We’re using our approach to understand, study, and impact the course of these diseases.
Q: What is the G3 approach?
SV: Our approach is based on three fundamental pillars. The first pillar is deep phenotyping using imaging to quantify different aspects of disease. The second pillar is panomic profiling where we analyze the DNA, RNA, proteins, lipids, and other small molecules in blood samples. The third pillar is to integrate the deep phenotyping and panomics data using a systems biology—driven bioinformatics. The data analysis step of the clinical study consists of integrating billions of data points for each subject. The goal is to translate and make sense of the data to inform development of new diagnostics and therapeutics.
"...we begin with genomic data and work to fill in the gaps with gene expression, proteomics, lipidomics, metabolomic, and the other omics."
Q: Why are you performing so many sequencing and omics studies on these samples?
SV: We wanted to solve the issue of missing heritability. When we started the company in 2011, there were twin studies in cardiovascular disease that demonstrated that roughly half of the disease risk is caused by genetic and inherited factors, and roughly half by the environment.1 We also knew that disease-associated variants could not explain more than 5–7% of cardiovascular disease phenotypes. In addition, 97% of disease-associated SNPs are not found in exomes, the genome regions that are translated into proteins.2 We started to think about how we could fill in those gaps and find the missing heritability in multifactorial diseases.
We realized that while genetic variants might increase someone’s chances of developing a disease, they don’t provide a picture over time of what is happening in the body. So that’s why we begin with genomic data and work to fill in the gaps with gene expression, proteomics, lipidomics, metabolomic, and the other omics. It’s the fundamental concept behind the company.
Q: Why did you decide to undertake such a large and ambitious clinical study?
SV: We realized that if we wanted to transform drug and biomarker discovery based on big data, we had to demonstrate the approach in a large clinical study. In 2013, we began enrollment for our GLOBAL study, an ambitious effort to prospectively collect samples from a global patient population. We knew that the study had to be large, with the statistical power needed to obtain useful data. Based on our calculations, the sample size was somewhere between 6500–7000. We ended up enrolling 7700–7800 patients at 48 clinical sites in nine countries on three continents. We believe that this is the largest and most comprehensive prospective study to collect multiomic data for the specific purpose of drug and biomarker discovery.
Q: How could a clinical trial of 8000 subjects have the statistical power necessary to detect variant associations?
SV: We're layering several omics measurements to understand the functional implications of each variant. Because the biological pathways converge onto each other, we're able to reduce the number of subjects needed to have the statistical power necessary to detect associations.
Q: What is the status of the clinical study?
SV: We completed enrollment in the GLOBAL clinical study in mid-2014. We’ve sequenced every gene in thousands of people and measured hundreds of thousands of intermediate biomarkers in the same subjects. We have all the raw data, images, and blood samples and are about halfway through the omics analysis. Theoretically, we’ll be able to validate any target, for any disease, for which we have phenotype information. For the next few years, we’ll be going through the data and identifying targets for the common chronic diseases that we’re interested in.
"Bayesian analyses uncovered hierarchical panomic networks that converged onto the same biological pathway...with gene variance driving the networks, followed by RNA and protein networks."
Q: How many data points are you analyzing?
SV: For the imaging aspect, we took CAT scans of the chest, heart, and upper abdomen, with and without contrast. On each of the blood samples we performed whole-genome sequencing (WGS), assessed transcriptional events with RNA-Seq and microRNA analysis, and studied epigenetics with DNA methylation analysis. We also performed proteomics, lipidomics, and metabolomics studies to assess small molecules. It adds up to several billion data points for each subject in the trial (Figure 1).
Q: Given the number of analyses performed on each blood sample, how do you ensure data quality?
SV: From the beginning, we felt it was important to ensure data quality at the collection level. We take great care in how we treat those samples. After the blood is drawn, it is spun down and separated into 47 aliquots that are refrigerated within 70 minutes of the phlebotomy. We separate the aliquots into A and B samples, which are then shipped on different days, on different trucks or planes, to different states, for disaster recovery purposes.
When we have the blood samples in our biobanks, best-in-class service providers perform the different omics analyses, including Illumina Sequencing Services for WGS and Expression Analysis/IQVIA for RNA-Seq, miRNA-Seq, DNA methylation, protein, lipid, and small molecule/metabolite analysis.
Q: What scientific observations have you made?
SV: We have made a large number of scientific observations but at the highest level, there are two major insights. The first one revealed functional convergence, validating our concept. In one of our early analyses, we had one trillion data points in hundreds of patients and looked for pathways that lead to cardiovascular disease, nonalcoholic steatohepatitis (NASH), and osteoporosis. Bayesian analyses uncovered hierarchical panomic networks that converged onto the same biological pathway. They were just like we would expect based on the biological dogma with gene variance driving the networks, followed by RNA and protein networks. We also rediscovered known pathways, including the LDL pathway, one of the best known cardiovascular disease pathways.
Our second observation is a little more obscure. We looked across the genome for the top hits or strongest associations in each “omics” dataset for each disease state. Rather than being randomly distributed across the genome, we found the hits in clusters. We’re starting to determine scientifically what the relevance of that is.
"...identified a potential target from the transcriptomic data. We were then able to use WGS data and performed genetic validation of the target based on LOF variants."
Q: Have you identified new targets using your panomics approach that have commercial potential?
SV: We were granted a patent on a diagnostic biomarker we identified for cardiovascular disease. It was derived from the mass spectrometry—driven metabolomics data. It’s a very simple blood test that could be a gatekeeper to stress testing in patients who come to a physician’s office with chest pain.
We were successful in identifying another target under a collaboration with a large pharmaceutical company. The unbiased Bayesian network analysis identified a potential target from the transcriptomic data. We were then able to use WGS data and performed genetic validation of the target based on loss-of-function (LOF) variants. Our pharmaceutical partner confirmed the NASH target in an in vitro setting.
We also identified a new biological pathway and drug target for cardiovascular and fatty liver disease. The pathway is an intersection of the two disease pathways. We’re beginning development of a drug based on this target. The fact that we rediscovered known pathways using our panomics approach gives us confidence in the validity of this and several other new pathways that we’ve identified.
What’s amazing is that these discoveries are based on data from just the first few thousand subjects that we’ve analyzed. We haven’t even scratched the surface of all the data yet.
Q: Could the panomic approach introduce new concepts to drug development?
SV: The panomic approach accelerates the current time- and cost-intensive process of identifying and validating genetic variants. For example, GWAS identified the chromosome 9p21 locus associated with an increased risk of coronary artery calcification (CAD) events.3 It took almost 15 years to understand the functional aspects of those variants. One of the latest therapies in cardiovascular disease targets the PCSK9 protease. The initial observations were done on about 7000—9000 patients and it took many years to identify the target.
Our approach accelerates the identification of a variant’s functional consequence in two ways. First, we’re using WGS to look at each variant. As opposed to genotyping approaches that rely on previously identified variants, the variants we find using WGS are based on the difference in Cases and Controls in our own data set. We are not biased by previously performed studies. In fact, some of the important variants we identified for some of our novel targets were discovered this way.
Second, we are making several omics measurements to understand the functional implications of that variant. We’ve introduced the concept of omics quantitative trait loci (oQTL) where we perform quantitative analysis against gene expression, microRNAs, proteins, lipids, and metabolites for a single variant. With this data, we’re able to gain the same insights based on a few hundred patients. For example, our NASH target was identified in just a few months after the data set had been collected and validation was completed at a high statistical significant level in < 500 patients.
Clinical studies are a significant financial investment for drug development. We believe that our panomic approach could reduce the amount of money required to develop new therapies.
"We believe that accurate WGS provides a significant incremental value over genotyping and whole-exome sequencing."
Q: What is the value of WGS in the panomics approach?
SV: We use WGS primarily for genetic target validation. However, we are often able to identify a potential target from the functional nonDNA data generated from our proteomics or gene expression studies. To validate it, we go to the WGS data and look at the gene that encodes that protein or receptor. We then identify the variants within that gene and look for LOF variants associated with the biomarker and phenotype of the disease. We used that approach in identifying the NASH target.
Q: How did you select your omics analysis partners?
SV: When we founded G3, we had two options. One was to buy all the equipment and perform omics measurements in our own lab, or outsource everything to best-in-class providers. After we completed our due diligence, it was clear that the right answer was to outsource.
We selected Illumina FastTrack Sequencing Services to be our WGS service provider. In my previous academic career, I used the iScan System and Infinium genotyping arrays to perform GWAS for cardiovascular disease. I knew that Illumina products were reliable and accurate and that the company provided good support. We believe that accurate WGS provides a significant incremental value over genotyping and whole-exome sequencing.
I had worked successfully with Expression Analysis/IQVIA prior to founding G3. We chose it to perform the other omics studies, some of which are with Illumina products. For example, Expression Analysis is performing RNA- and microRNA-Seq on the HiSeq 4000 System and DNA methylation analysis on the Human Methylation 450K BeadChip.
"The panomic approach accelerates the current time- and cost-intensive process of identifying and validating genetic variants."
Q: What are the next steps for G3?
SV: We’re excited to see what the next few years bring. Just seven years into this journey, we have blood tests coming to market and several drug targets in development. Now that we’ve demonstrated the value of our panomics approach in cardiovascular, cardiometabolic, and liver disease, we’d like to apply it to other disease states. Alzheimer’s disease is of particular interest. It is a multifactorial, multigenic common chronic disease and will require quantitative precision phenotyping, coupled with our panomics approach. We’re seeking partners to study Alzheimer’s disease and other dementias. We would like to take the same approach and apply it to neurodegenerative and musculoskeletal diseases. We would eventually like to initiate projects in oncology as well.
Q: How could the G3 approach impact health care?
SV: The 1990s and early 2000s were an era of population-based, guideline-driven medicine. We hope our approach is instrumental in transitioning to a molecular profile—driven, individualized approach. Our vision is that when physicians walk into an exam room in the future, our approach will enable them to review the patient’s profile and molecular fingerprint, and prescribe a personalized therapy for the patient sitting across from them.
Learn more about how G3 is bringing all the omics together:
Learn more about the products and services mentioned in this article:
Illumina Sequencing Platforms (The HiSeq 4000 System has been discontinued; the NovaSeq System is a recommended replacement).
Sequencing Services (FastTrack Services has been renamed to Illumina Laboratory Services).
Explore other related content:
Drug Discovery and Development
References
- Marenberg ME, Risch N, Berkman LF, et al. Genetic susceptibility to death from coronary heart disease in a study of twins. N Engl J Med. 1994; 330:1041-1046.
- Maurano MT, Humbert R, Rynes E, et al. Systematic localization of common disease-associated variation in regulatory DNA. Science. 2012; 337:1190-1195.
- McPherson R, Pertsemlidis A, Kavaslar N, et al. A common allele on chromosome 9 associated with coronary heart disease. Science. 2007;316:1488-1491.