Introduction
Spinal muscular atrophy (SMA), an autosomal recessive neuromuscular disorder characterized by loss of alpha motor neurons, causes severe muscle weakness and atrophy presenting at or shortly after birth1. SMA is the leading genetic cause of infant death after cystic fibrosis. The incidence of SMA is 1 in 6000-10,000 live births, and the carrier frequency is 1:40-80 among different ethnic groups2–4. Early detection of SMA can be critical for long term quality of life due to the availability of two early treatments, Nusinersen5 and Zolgensma6, which have received FDA approval for the amelioration of SMA symptoms.
The disease-causing gene, SMN1, together with its paralog SMN2, reside in a ~2Mb region on chromosome 5 with a large number of complicated segmental and inverted segmental duplications. SMN2 was created by an ancestral gene duplication that is unique to the human lineage7. The genomic region around SMN1 and SMN2 is subject to unequal crossing-over and gene conversion, resulting in variable copy numbers (CNs) of SMN1 and SMN2. Importantly, SMN2 has >99.9% sequence identity to SMN1 and one of the base differences, c.840C>T in exon 7, has a critical functional consequence. By interrupting a splicing enhancer, c.840T promotes skipping of exon 7, resulting in the vast majority of SMN2-derived transcripts being unstable and not fully functional8. Approximately 95% of SMA cases result from biallelic absence of the functional c.840C nucleotide caused by either a deletion of SMN1 or gene conversion to SMN2 (c.840T)9. In the remaining 5% of SMA cases, patients also have other pathogenic variants in SMN110. SMN2 can produce a small amount of functional protein, and the number of SMN2 copies in an individual is inversely correlated with the disease severity11.
Due to the high incidence rate and disease severity, population-wide SMA screening is recommended by the American College of Medical Genetics. The key to screening for SMA is: 1) determining the copy number of SMN1 for SMA diagnosis and carrier testing and 2) determining the copy number of SMN2 for clinical classification and prognosis. Traditionally, SMA testing and carrier testing are done with polymerase chain reaction (PCR) based assays, such as quantitative PCR (qPCR), multiplex ligation-dependent probe amplification (MLPA) and digital PCR. These methods primarily determine the copy number of SMN1 based on the c.840C>T site that differs between SMN1 and SMN2. Enabling SMA testing with WGS would greatly benefit precision medicine initiatives, but it faces challenges including the almost perfect sequence identity between SMN1 and SMN2, and frequent gene conversion between the two genes leading to hybrid genes. These challenges demand an informatics method specifically designed to overcome the difficulties of this region.
To solve this problem, we developed SMNCopyNumberCaller12, a novel method that detects the CN of both SMN1 and SMN2 based on WGS data. This method was developed using population data from the 1000 Genomes Project13 (1kGP). In our publication of this method, we characterized SMN1 and SMN2 in 12,747 genomes, identified 1568 samples with SMN1 gains or losses and 6615 samples with SMN2 gains or losses, and calculated a pan-ethnic carrier frequency of 2%, consistent with previous studies. Additionally, 99.8% of our SMN1 and 99.7% of SMN2 CN calls agreed with orthogonal methods, with a recall of 100% for SMA and 97.8% for carriers, and a precision of 100% for both SMA and carriers. This caller enables SMA testing to be offered as a comprehensive test in neonatal care and an accurate carrier screening tool in WGS sequencing projects.
Here, we describe how, by using multi-ethnic samples, we were able to identify higher genetic variability in African populations and exclude variable sites that cannot reliably differentiate SMN1 from SMN2, optimizing accuracy across all populations. This highlights the importance of using ethnically diverse populations when developing novel informatic methods. Additionally, we describe and present a visualization tool that produces static images which allow users to review the evidence supporting the copy number calls made in these genes. This information will be an essential tool for clinical labs that wish to implement WGS-based SMA calling.
SMNCopyNumberCaller
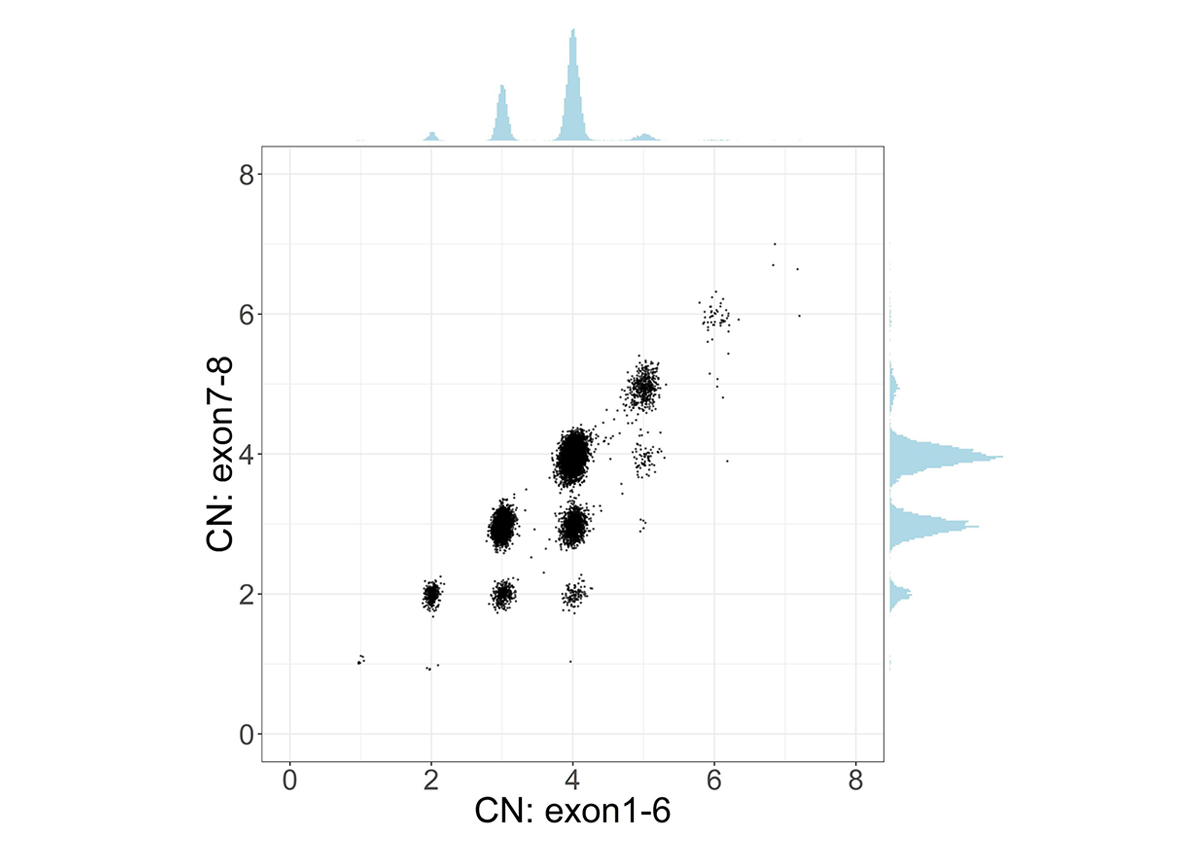
To address the challenge of high sequence similarity throughout the two genes, SMNCopyNumberCaller first calculates the summed copy number of SMN1 and SMN2, collectively termed SMN, by analyzing the sequencing coverage of reads aligned to either gene. Since there exists a truncated form of SMN2, termed SMN2∆7-8, with exons 7-8 deleted, we calculate the copy number of intact and truncated SMN forms by dividing the genes into two regions: the 22.2kb region that includes exons 1-6 and the 6.3kb region that includes exons 7-8. The CN calculated from the exons 7-8 region provides the number of intact SMN genes. Samples with SMN2∆7-8 have a higher CN of the exons 1-6 region compared to the CN of the exons 7-8 region, and this difference represents the CN of SMN2∆7-8 (Figure 1).

Scatter plot and histograms of total SMN (SMN1 + SMN2) copy number (x axis, called by read depth in Exon 1-6) and intact SMN copy number (y axis, called by read depth in Exon 7-8) in the population. Clusters below the diagonal indicate the presence of genes with the deletion of exon7-8 (ie, SMN2∆7-8).
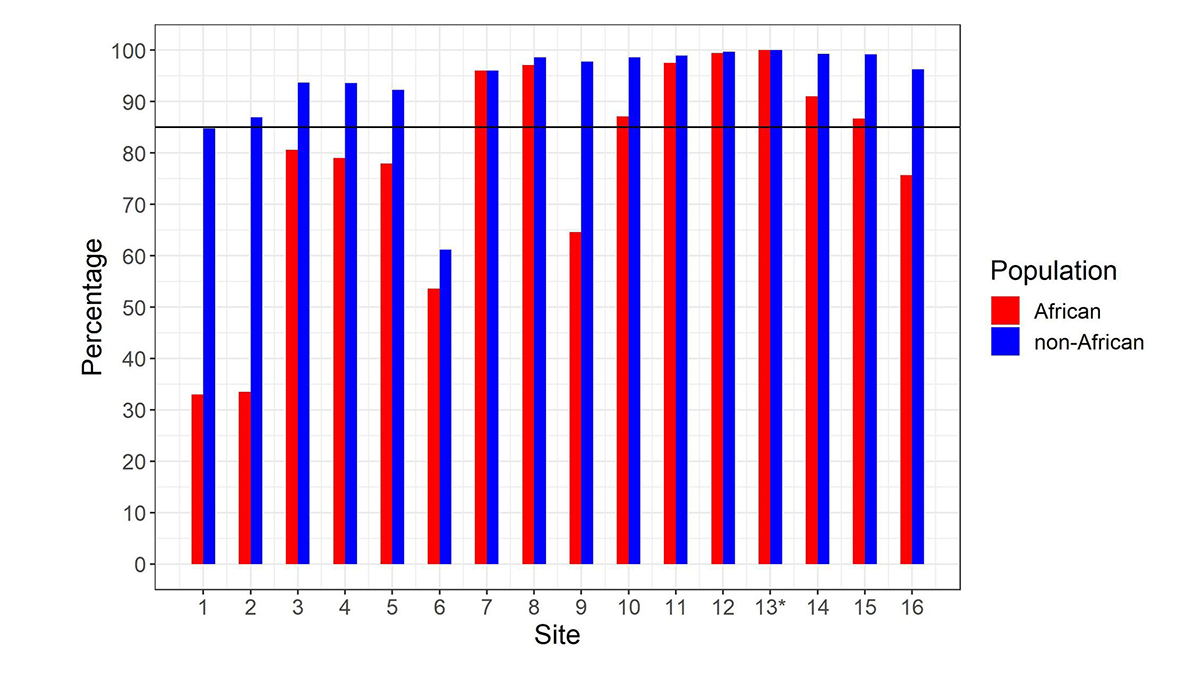
After calculating the summed copy number, we differentiate SMN1 from SMN2 using supporting read counts at base differences between SMN1 and SMN2. The individual CN of SMN1 (SMN2) at each site is calculated by considering the summed SMN CN and the fraction of SMN1 (SMN2) supporting reads out of all SMN1+SMN2 supporting reads. During the development of the caller, we called the CNs of SMN1 and SMN2 at the 16 base difference sites between them, extracted from the reference genome, in 1kGP samples, and determined if the CN calls for each position were concordant with the CN calls at the c.840C>T splice variant site. There was a notable difference between the concordance of calls in the African and non-African populations (Figure 2). Excluding the African samples, there were 13 sites that had high (>85%) CN concordance with the splice variant site. Conversely, for the African samples there were only seven sites that had high CN concordance with the splice variant site, and the concordance values were lower at all sites than in non-African populations. This is consistent with within-gene variation at many of these positions in the African population. This analysis highlights the importance of using ethnically diverse populations when developing novel informatic methods to resolve difficult clinically relevant regions of the genome.
We selected eight SMN1/2 base differences, including the splice variant site and the seven positions that were highly concordant with the splice variant site in both African and non-African populations. By selecting just these sites, this caller should perform consistently, independent of ethnicity. SMNCopyNumberCaller makes SMN1 and SMN2 CN calls based on the consensus of CN calls at the eight selected sites.

Percentage of samples showing copy number (CN) call agreement with c.840C>T across 16 SMN1–SMN2 base difference sites in African and non-African populations. Site 13* is the c.840C>T splice variant site. The black horizontal line denotes 85% concordance. To work for all populations, the SMNCopyNumberCaller just uses the eight sites that are >85% concordant in both African and non-African populations (ie, 7, 8, 10, 11, 12, 13, 14 & 15). Coordinates (hg38, chr5) of these 8 sites are: 70950493, 70950966, 70951392, 70951463, 70951897, 70951946, 70952094 and 70952209.
Visualizing the caller result
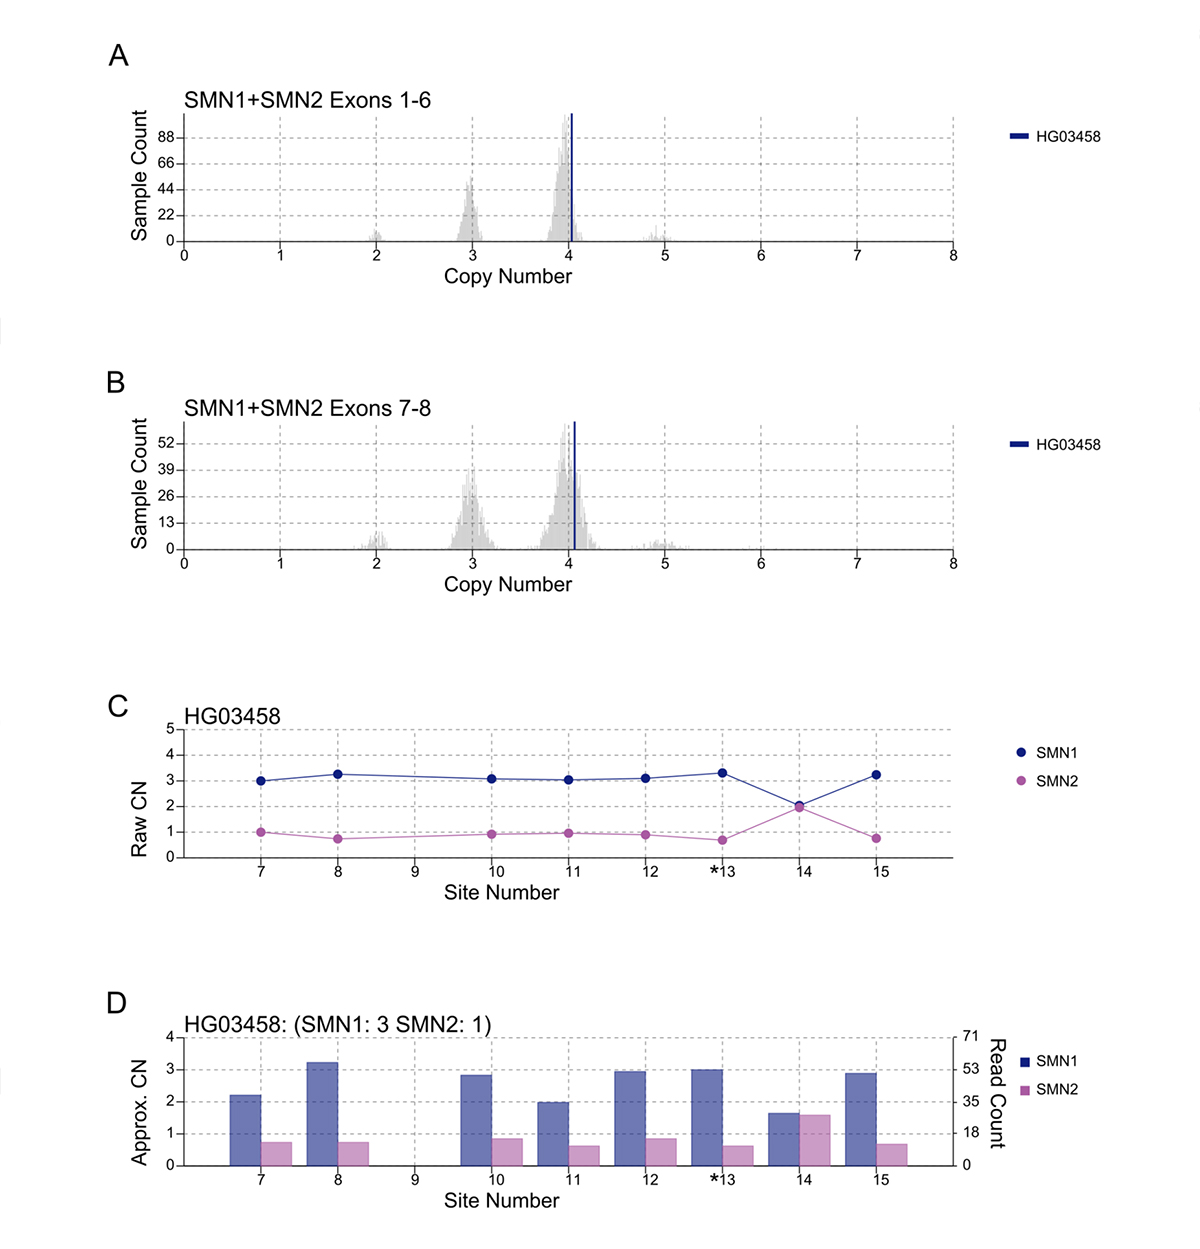
An important component of variant calling in clinical settings is the need to review the supporting evidence when signing out a clinical report. Since the release of SMNCopyNumberCaller, we have developed a visualization tool to produce static images that represent the data and QC the calls (Figure 3). The summed CNs of total (exons 1-6, Figure 3A) and intact (exons 7-8, Figure 3B) SMN (SMN1+SMN2) are plotted against the population distribution. The difference between the total and intact SMN CN represents the CN of SMN2∆7-8. Individual CNs of SMN1 and SMN2 are calculated based on the summed intact CN and the supporting read counts at eight base differences between SMN1 and SMN2 (#7-8 and #10-15, Figure 3C). Figure 3D provides a rough estimate of the SMN1 and SMN2 copy numbers based purely on read counts at the differentiating sites.

A/B. Raw depth values (vertical lines) against 1kGP population samples for the total SMN CN (A) and the intact SMN CN (B). C. Raw CN values for SMN1 and SMN2 at 8 sites (#7-8, #10-15) that are used to determine the consensus. The raw CN of SMN1 (SMN2) at each site is calculated as the CN of intact SMN times the fraction of SMN1 (SMN2) supporting read counts out of SMN1 + SMN2 supporting read counts. *13 is the splice variant site. D. Raw read counts for SMN1 and SMN2 are shown on the right y axis. The left y axis shows a rough calculation of CN, estimated by the read count divided by the median haploid depth of the sample.
Performance validation
To demonstrate the accuracy of this method, we compared CN calls using digital PCR and MLPA with our WGS-based calls and showed a concordance of 99.8% for SMN1 and 99.7% for SMN2, with a recall of 100% for SMA and 97.8% for carriers, and a precision of 100% for both SMA and carriers (Table 1).
| CN by orthogonal method | Total | Concordant | Discordant | Agreement | |
|---|---|---|---|---|---|
| SMN1 | 0 | 64 | 64 | 0 | 100.0% |
| 1 | 45 | 44 | 1 | 97.8% | |
| 2 | 897 | 897 | 0 | 100.0% | |
| 3 | 174 | 174 | 0 | 100.0% | |
| 4 | 43 | 43 | 0 | 100.0% | |
| 6 | 1 | 0 | 1 | 0.0% | |
| Total | 1224 | 1222 | 2 | 99.8% | |
| SMN2 | 0 | 117 | 117 | 0 | 100.0% |
| 1 | 486 | 465 | 1 | 99.8% | |
| 2 | 541 | 539 | 2 | 99.6% | |
| 3 | 60 | 60 | 0 | 100.0% | |
| 4 | 9 | 8 | 1 | 88.9% | |
| Total | 1193 | 1189 | 4 | 99.7% | |
| SMN2∆7-8 | 0 | 1089 | 1089 | 0 | 100.0% |
| 1 | 80 | 80 | 0 | 100.0% | |
| 2 | 4 | 4 | 0 | 100.0% | |
| Total | 1173 | 1173 | 0 | 100.0% |
Copy number of SMN1, SMN2 and SMN2∆7-8 by population
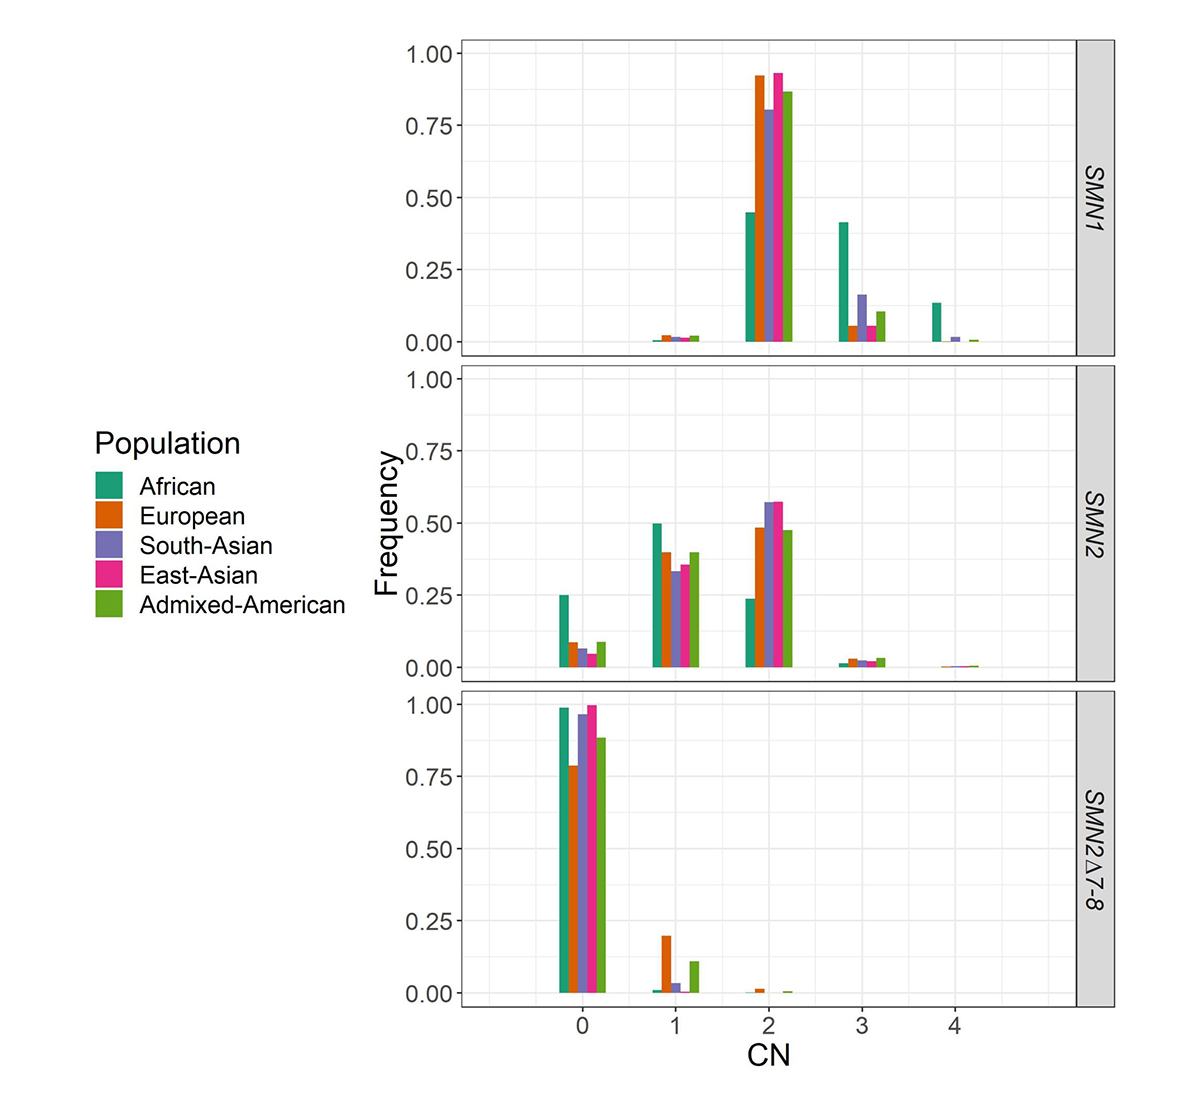
We applied SMNCopyNumberCaller to 2504 unrelated samples from the 1000 Genomes Project (1kGP) and 10,243 unrelated samples from the NIHR BioResource Project14 to report on the population distributions of SMN1 and SMN2 copy numbers (Figure 4). The carrier frequencies for SMA (samples with one copy of SMN1) using this method agreed with those reported by previous PCR-based studies2,4. Particularly, the variability of SMN1 copy number is much lower than that of SMN2 copy number in most populations, and Africans have a much higher SMN1 copy number than other populations.

Histogram of the distribution of SMN1, SMN2, and SMN2Δ7–8 copy numbers across five populations in 1kGP and the National Institute for Health Research (NIHR) BioResource cohort.
Summary
Our SMNCopyNumberCaller can be used to identify both carrier and affected status of SMA, enabling SMA testing to be offered as a comprehensive test in neonatal care and an accurate carrier screening tool in WGS sequencing projects. While there exist difficult regions in the genome where normal WGS pipelines do not deliver variant calls, here we demonstrate the ability to apply WGS paired with a targeted informatics approach to solve one such difficult region. WGS provides a valuable opportunity to assess the entire genome for genetic variation and the continued development of more targeted informatics solutions for difficult regions with WGS data will help bring the promise of personalized medicine one step closer to a reality.
For more information or a DRAGEN trial license for academic use, please contact dragen-info@illumina.com.
Acknowledgements
We thank our co-authors Alba Sanchis-Juan, Courtney French, Isabelle Delon and Lucy Raymond at University of Cambridge, Andrew Connell and Matthew Butchbach at Nemours Alfred I. duPont Hospital for Children, as well as Zoya Kingsbury, Aditi Chawla, Aaron Halpern, Ryan Taft and David Bentley at Illumina. We thank Andrew Warren at Illumina for developing the visualization tool.
External links
- Publication: https://www.nature.com/articles/s41436-020-0754-0
- Software: https://github.com/Illumina/SMNCopyNumberCaller
References
- Lunn MR, Wang CH. Spinal muscular atrophy Lancet. 2008; 371(9630):2120–2133.
- Sugarman EA, Nagan N, Zhu H, Akmaev VR, Zhou Z, Rohlfs EM, et al. Pan-ethnic carrier screening and prenatal diagnosis for spinal muscular atrophy: clinical laboratory analysis of >72 400 specimens. Eur J Hum Genet. 2012;20(1):27–32.
- MacDonald, WK, Hamilton, D, Kuhle S. SMA carrier testing: a meta-analysis of differences in test performance by ethnic group. Prenat Diagn. 2014;34(12):1219-1226.
- Hendrickson BC, Donohoe C, Akmaev VR, Sugarman EA, Labrousse P, Boguslavskiy L, et al. Differences in SMN1 allele frequencies among ethnic groups within North America. J Med Genet. 2009;46(9):641–644.
- Finkel RS, Chiriboga CA, Vajsar J, Day JW, Montes J, De Vivo DC, et al. Treatment of infantile-onset spinal muscular atrophy with nusinersen: a phase 2, open-label, dose-escalation study. Lancet. 2016;388(10063):3017–3026.
- Mendell JR, Al-Zaidy S, Shell R, Arnold WD, Rodino-Klapac LR, Prior TW, et al. Single-dose gene-replacement therapy for spinal muscular atrophy N Engl J Med. 2017;377(18);1713–1722.
- Rochette CF, Gilbert N, Simard LR. SMN gene duplication and the emergence of the SMN2 gene occurred in distinct hominids: SMN2 is unique to Homo sapiens. Hum Genet. 2001;108(3):255–266.
- Lorson CL, Hahnen E, Androphy EJ, Wirth B. A single nucleotide in the SMN gene regulates splicing and is responsible for spinal muscular atrophy. Proc Natl Acad Sci U S A. 1999;96(11):6307–6311.
- Wirth B. An update of the mutation spectrum of the survival motor neuron gene (SMN1) in autosomal recessive spinal muscular atrophy (SMA). Hum Mutat. 2000;15(3):228–237.
- Burghes AH, Beattie CE. Spinal muscular atrophy: why do low levels of survival motor neuron protein make motor neurons sick? Nat Rev Neurosci. 2009;10(8):597-609.
- Butchbach ME. Copy number variations in the survival motor neuron genes: implications for spinal muscular atrophy and other neurodegenerative diseases. Front Mol Biosci. 2016;3:7.
- Chen X, Sanchis-Juan A, French CE, Connell AJ, Delon I, Kingsbury Z, et al. Spinal muscular atrophy diagnosis and carrier screening from genome sequencing data. Genet Med. 2020;22(5):945-953.
- 1000 Genomes Project Consortium. A global reference for human genetic variation. Nature. 2015;526(7571):68-74.
- Turro E, Astle WJ, Megy K, Gräf S, Greene D, Shamardina O, et al. Whole-genome sequencing of patients with rare diseases in a national health system. Nature. 2020;583(7814):96-102.