Abstract
This article presents how Illumina Connected Analytics (ICA) platform is used as the foundation on which a customized genomics analysis environment is built. The environment manages and processes large amounts of heterogenous data sets, including both genomic and phenotypic data.
All the required functionalities are built on top of the ICA platform components. Some of the functionalities offered include extract, transform and load (ETL) and scalable data storage in a data warehouse; both high- and low-level data query which allows flexible and efficient use of the system; pre-packaged, advanced analysis, that includes workflow specification, distributed data processing and result visualization.
We will conclude on commenting how implementing the various required functionalities took advantage on running on a consistent platform and discuss the benefits and lessons learned.
Introduction
The landscape of genomic data analysis is becoming more complex due to the richness and large volume of data available. Including genetic information into human healthcare will have a large impact in various areas, such as understanding the role that genes play in disease, how genetics influence existing drug responses or developing new drugs.
In order to reach the full potential of genomics in healthcare, researchers need both data – which becomes more readily available – as well as advanced systems in which they can easily analyze the data.
In this article we describe the work done towards a complex genomics analysis environment, based on the Illumina Connected Analytics® (ICA) platform. We will start by briefly presenting the platform and give further details on the objectives of the environment. We then discuss the improvements and components build. We comment on the usage of the genomics analysis environment during drug target discovery research activities . We conclude with lessons learned.
The ICA platform
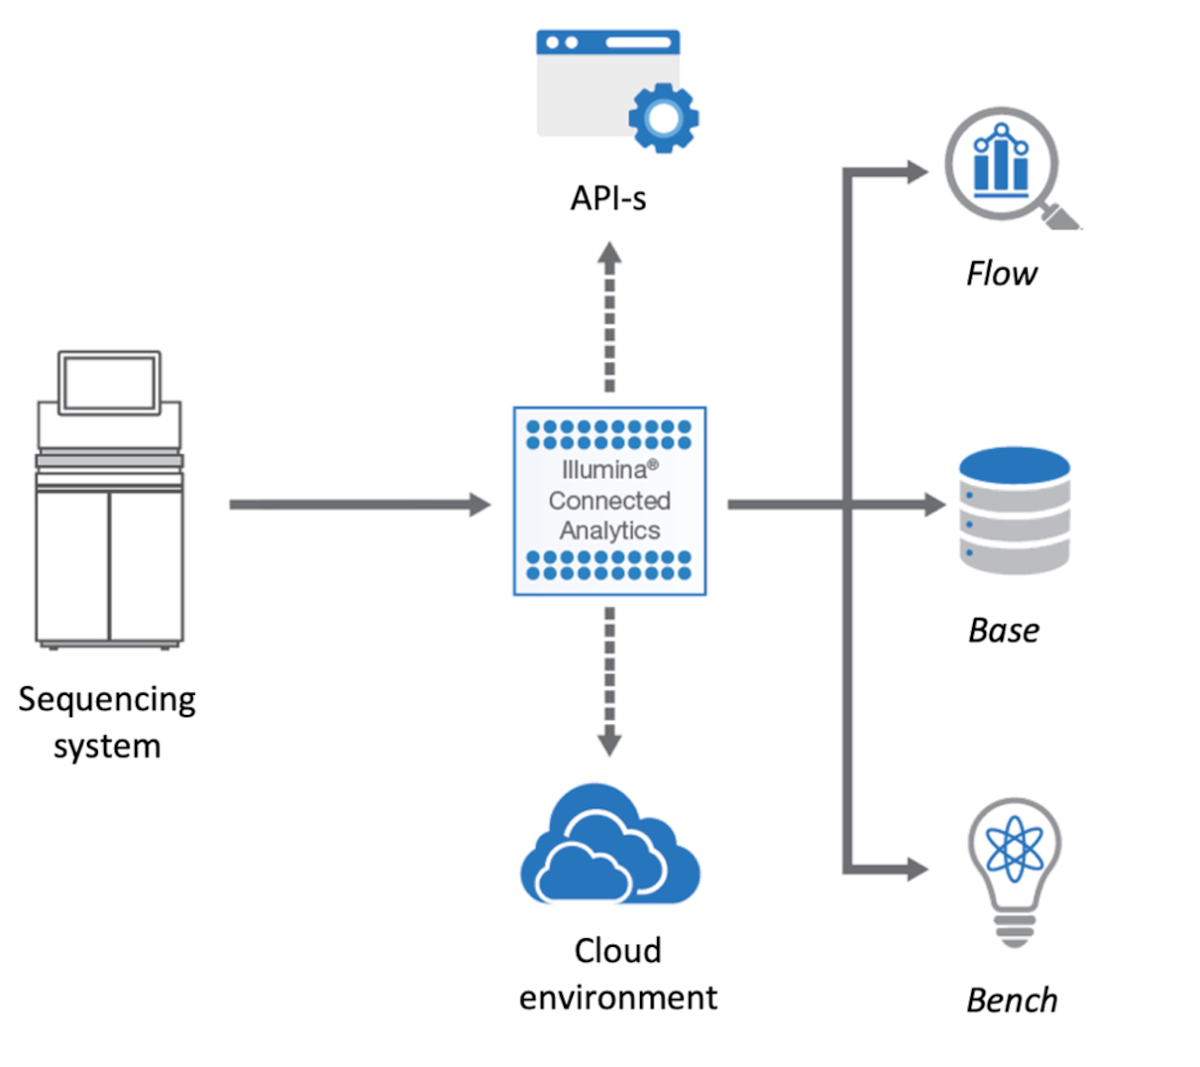
The ICA platform is the foundation on which we built the genomics analysis environment. ICA is an modern cloud-based platform that enables complex use-cases to be addressed, and which we have further enhanced with research-oriented extensions. The platform provides all the necessary infrastructure and features required for building a solution and it is dealing “out of the box” with many of the required non-functional aspects such as encryption, backup, cloud instance provisioning, audit, etc.
The ICA components most relevant to our work are:
- Bench – an interactive data science environment that can be used both for research and custom, complex visualizations
- Base – an efficient and scalable data warehouse solution that can store heterogeneous data
- Flow – an extensible workflow execution engine, that supports “out of the box” bio-informatics tools
- Genomic Data Storage (GDS) – a file management and storing service used by all the other modules
An overview in the platform can be seen in Figure 1.
The genomics analysis environment (GAE)
The objective of the analysis environment is to enable the analysis of the genetic markers, phenotype data, electronic medical records (EMR) data and any other reference databases required. Such analyses enable various use-cases that can guide, for example, drug target identification and discovery.
Building a GAE on top of ICA uses all the components of the platform and entails many deliverables:
- An approach to manage the data storage, including what type of data is stored under what format, what schema is used for structured data, and how the data can be accessed, backed-up and secured. This part relies on GDS and Base.
- Workflows to perform large, complex computations in a fast and cost-effective fashion. These complement the existing set of workflows offered by the ICA platform (such as variant calling using Dragen, RNA analysis, etc.) with project specific requirements. This part relies on the Flow module of ICA.
- Scientific notebooks and source code templates and examples used in the data exploration part. Some examples are wrappers that hide the details when interacting with the platform components, which improves the efficiency of the researchers and allows them to focus on the actual analysis. This part relies on the Bench module of ICA.
- Additional visualizations which are integrated in the system. The visualization application orchestrates data ingestion and any preprocessing required for the visualization through integrating 3rd party visualization applications into Bench workspaces, for a seamless experience.
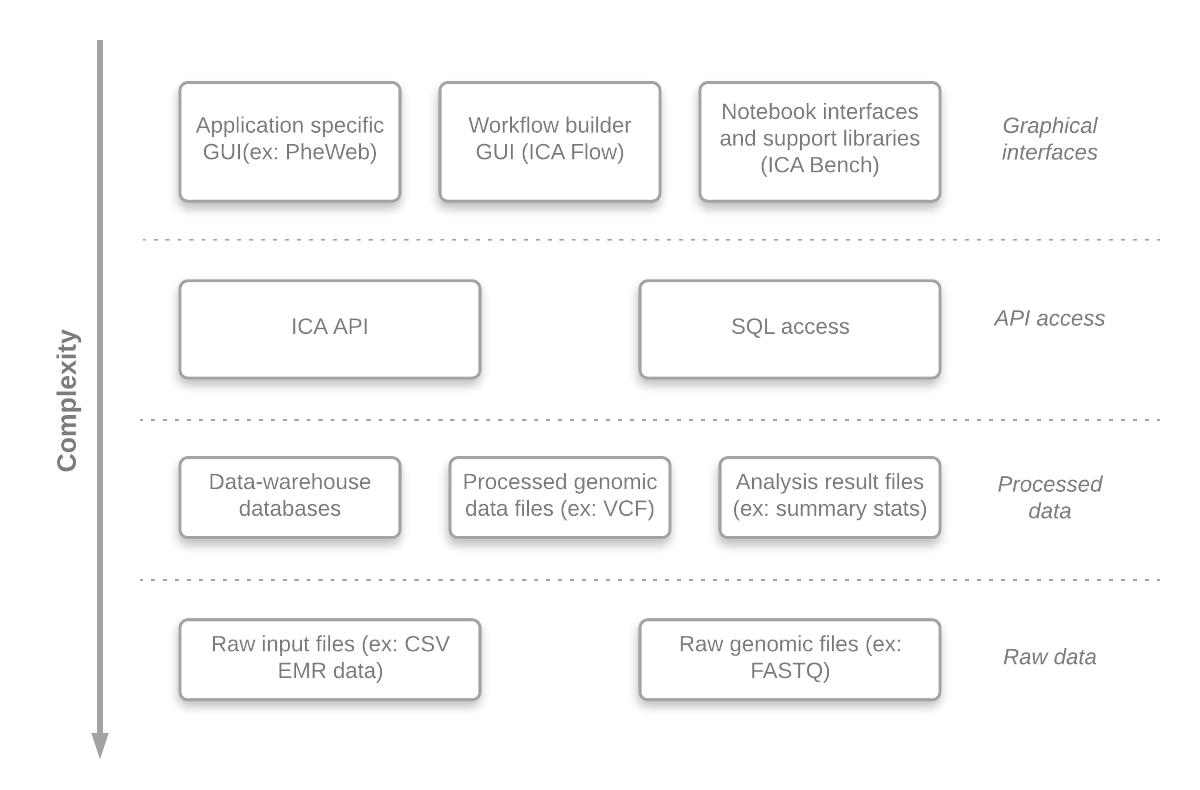
An important aim of the GAE is to offer access to different abstraction levels for its analyses, queries and visualizations, in a convenient manner. Researchers can easily develop (or just inspect) any component at different abstraction level. This gives the system a lot of flexibility and enables the researchers, if required, to adjust the system to their needs. The benefits are:
- Flexibility – researchers can create/modify existing assets
- Openness – researchers can use different methods/algorithms
- Control – results can be verified in detail
- Efficiency – researchers work with the abstraction level they are most comfortable
An overview of the abstraction levels is presented in Figure 2.
To describe in detail how the system works, we will use a synthetic and simplified use-case. This use-case should not be seen as the main purpose of the system, but rather as didactic example which allows the presentation of the system.
The use-case
For the purpose of this blog post, we will use the following hypothetical use case; The study attempts to find the region on the genome where variants correlate in a cohort of young(ish) patients (born after 1965) with a diagnosis of Diabetes, and using their Body Mass Index as a covariate.
For such an analysis to be possible we need genotypical, phenotypical and EMR data, and we discuss how this is ingested and processed. Although ingestion is not strictly part of the use-case, in many projects it is a relevant step. The data sources selected are the UK Bio Bank and FinnGen.
Components
We will present some of the components that are required for the example use case. During the discussion we will point out the benefits of using the ICA platform for this type of project and how using ICA can accelerate similar projects, building on existing code, experience and modules.
The components described next can be roughly split into ETL and storage components which are used during project setup and at predefined time moments to ingest/delete data. Query and analysis components that are used in the daily research activities. And custom visualization components used visualizing analysis outputs.
ETL – UK Bio Bank Phenotype Data
Ingesting UK Bio Bank phenotyope data is a challenge due to the size and heterogeneity of the data. The data has (at this moment) 7774 independent fields, with various data types (integer, categorical, continuous, date, etc.) and special characteristics (ex: different encodings, different collection times, different sizes, etc.).
The structured data is provided by UK Bio Bank in a textual (encrypted) format, that is not suitable for querying and integration with other data types.
Besides the structured data, some of the fields link to raw information such as images and genetic information (ex: imputed genotypes, exome, etc.) that needs to be processed in a different way.
We have made the following choices regarding loading the data:
- The simple structured data was loaded in the data warehouse system (Base module of ICA), separated in multiple tables and preserving enough information to allow direct interaction with the database if required (ex: keeping both field name and identifier in column name)
- The raw specific data was loaded separately in the storage system of ICA and was converted to the most appropriate format considering the tools that were used, while keeping all data available
The system provides convenient ways (library functions that take as a parameter the raw data file) that fulfill the following management tasks:
- Adding new data (ex: new measurements for some phenotypes)
- Removing data (ex: patient that withdraw their consent)
Each data field is described in detail in the data showcase website of UK Bio Bank. For example, field with id 2443 (is represented as 4 columns (one column for each instance):
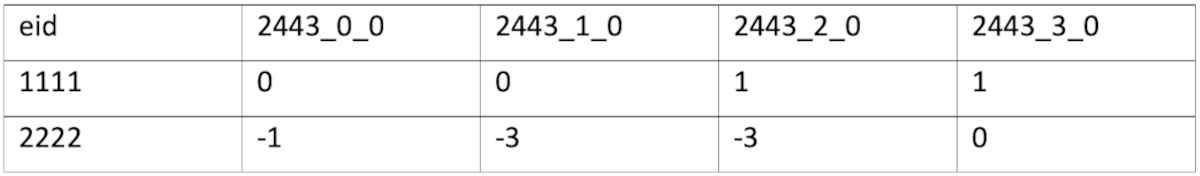
The meaning of the value in the columns is given by the data encoding, in this case where 0 represents “No”, 1 represents “Yes”, -1 represents “Don’t know” and -3 represents “Prefer not to answer”.
All the required information (raw data and encodings) are loaded as SQL tables, and table and field names are enhanced with actual names for readability. For the above example, all the instances are stored in the same column, like:
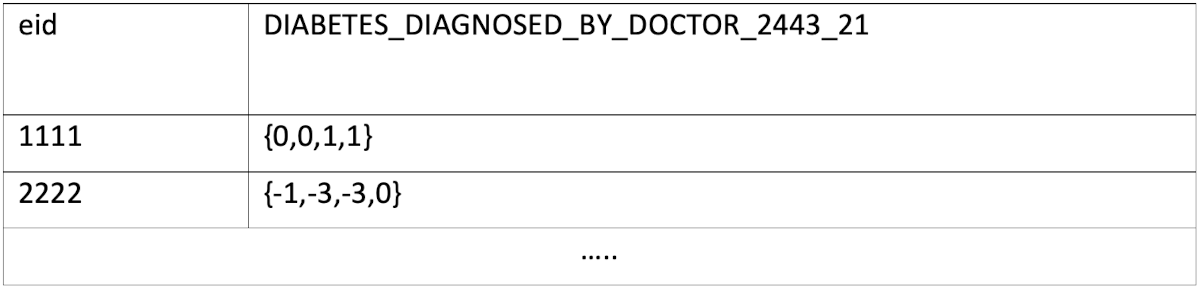
We will show in a subsequent section how this simplifies querying.
It is important to mention that while we have shown here an example of simple categorical data, the UK Bio Bank has multiple types of data (integer, float, date, time, etc.), with various characteristics (ex: instances – which are collections point in time; array values – multiple measurements; etc.)
ETL - Other GWAS studies
FinnGen is a Finish personalized medicine project that releases its data periodically. The data contains the results of a GWAS study done for 176K samples and 17M variants analyzed for 2444 phenotypes . FinnGen uses GRCh38 genome version.
Pan UK BioBank is a set of multiple ancestry analysis of the UK Bio Bank phenotypes across 6 ancestry groups. This results in a total of 16,119 genome-wide association studies summary statistics that are released to the community .
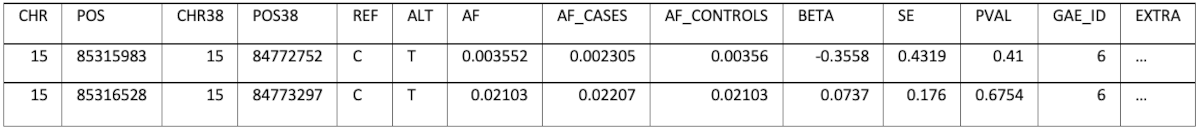
Converting of the position from one of the genome builds to the other and storing only one set of positions would result in information loss, because not all positions can be converted. The decision was to keep each data set’s original coordinates (GRCh38 and GRCh37) and also do the conversion to the missing build (for example: convert FinnGen positions also to GRCh37). This allows full control over the decision that could result in ignoring parts of the information when performing an analysis. The schema has a field (EXTRA) which can store additional, study specific information, as a JSON, which can also be queried if necessary. For example, for Pan UK Biobank the EXTRA field contains:
| { "pval_heterogeneity": 2.11e-01 } |
An example of the data stored is (some columns/values were omitted for brevity):
Analysis - Query component
One important aspect of the system is to allow an easy interaction with the data. For this purpose, an abstraction layer was built, to hide the details of the data storage, while allowing full control if required.
The best example for this is the UK Bio Bank phenotype data. This data is spread across multiple tables in the data warehouse and has several particularities:
- Encodings (ex: how is male/female encoded? How is a diagnostic encoded? etc.)
- Some data was collected at different points in time (ex: in 2005, then again in 2010) a concept called an instance.
- Some data is presented as time series (ex: hospital episodes)
You can see an example of the API Figure 3.
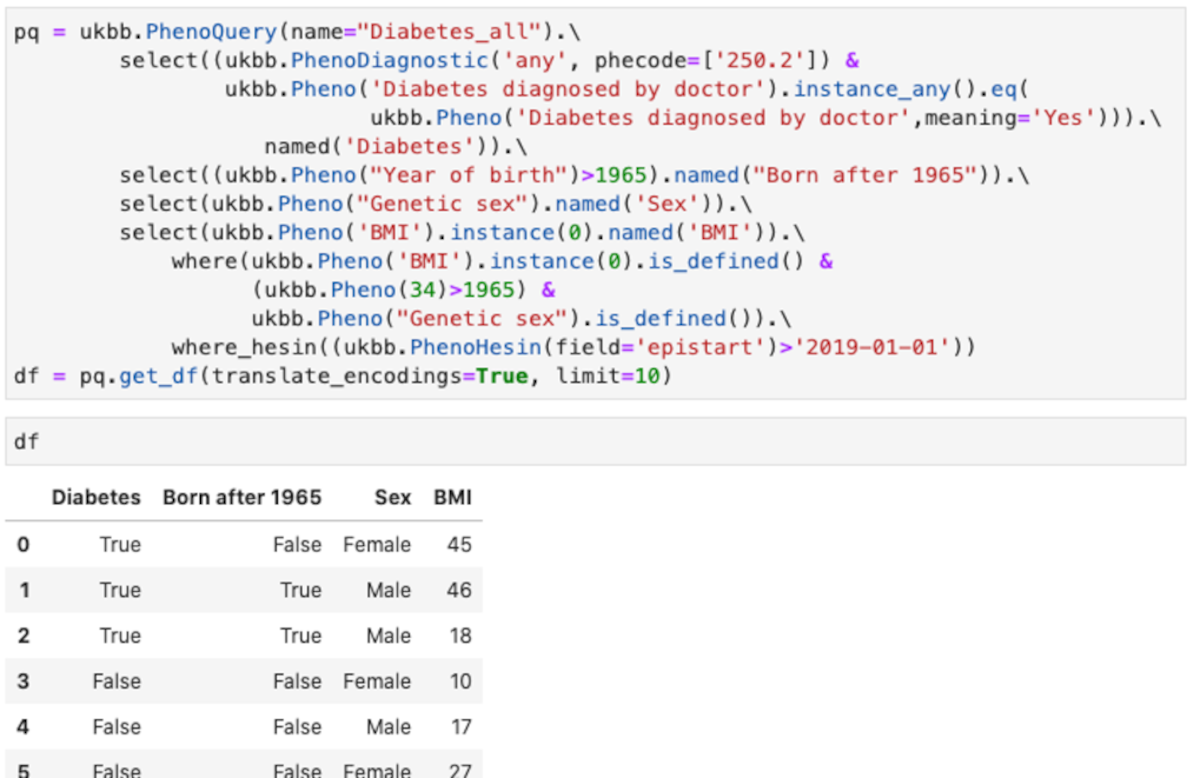
This query shows some of the feature of the abstraction:
- Uses different type of encoding for the diagnostic. The example shows phecodes from PheWasCatalog, but also ICD9 and ICD10 codes are supported.
- Using field titles or field codes. In the example most are field titles, but for “Year of birth”, the code field 34 is in the “where” clause.
- Making tests over all instances. In the example any instance in which the “Diabetes diagnosed by doctor” is “Yes” is used.
- Using the values instead of the encoded values. In the example “Yes”, instead of the numeric encoding used for “Diabetes diagnosed by doctor”
- Column names of the resulting data frame can be renamed as desired
- Multiple fields can be combined in conditions, both in “select” and in “where” clauses
- Hospital episodes intakes can be quired (ukbb.PhenoHesin)
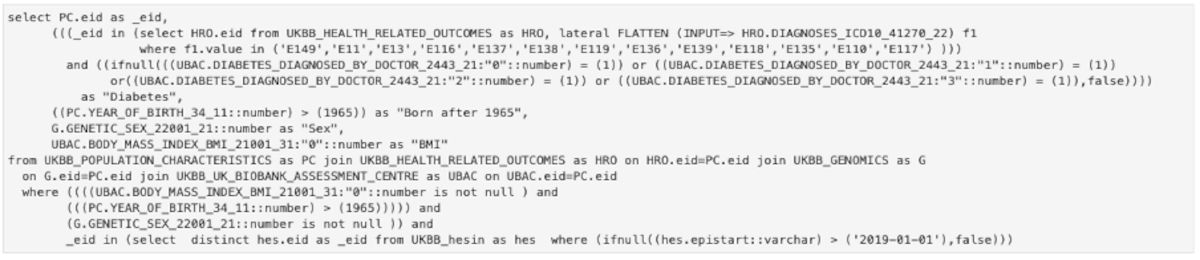
The purpose of the API is to enable the researcher to query the data easier, in a high-level manner. In case the API can’t provide a specific type of query, the user can use it as a starting point and then can adapt the lower-level SQL query to obtain the desired result. For the query in Figure 3, the complete SQL query is shown in Figure 4. It can be seen that while all the information is still there (field codes and titles, values searched, conditions, etc.) it is much harder to read and understand what the original intent was. This is for advanced use cases only and we continually try to improve the high-level API to support a wide range of cases.
Analysis – GWAS
Due to the intensive computational demands of GWAS analysis, full genome-scale GWAS analyses are not typically run in the Bench module of ICA, but rather as a workflow in the Flow module. Library functions (in python and R) are provided to make executing a GWAS as simple as possible.
The process is the following:
A sample cohort must be provided. This can be done either using a PhenoQuery (as described above) or in an alternate way that generates a data-frame containing the list of phenotype values and co-variates.
- Setup any GWAS and filtering parameters, such as an inclusion/exclusion regions, quality cutoffs, etc.
- Define the relevant phenotypes and the covariates
- Run the analysis
- Review the analysis and store the result for further use
All the results are stored in the data warehouse, for further analysis and storages, in the same structures in which FinnGen and PanUKBioBank data are stored. This makes queries and searches even more powerful as you can query the complete data set at once.
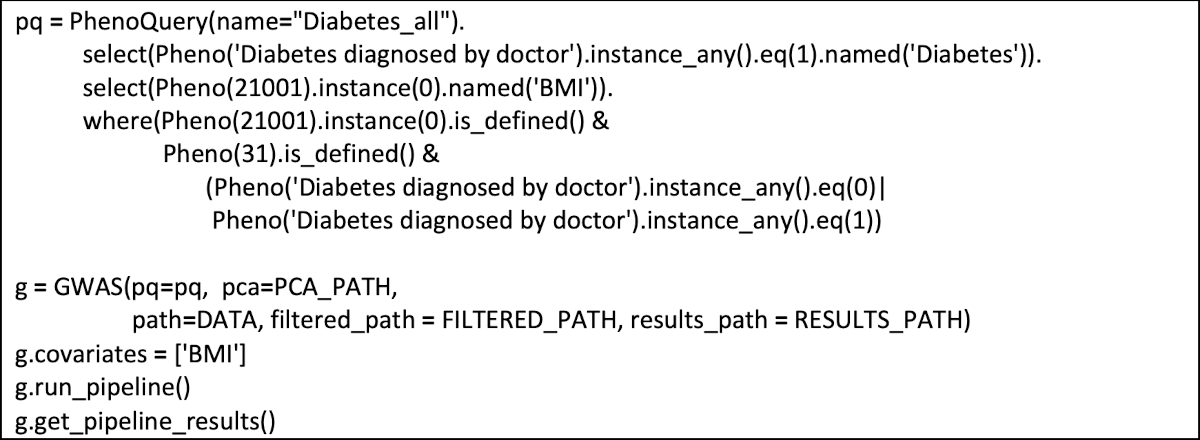
An example of execution is:

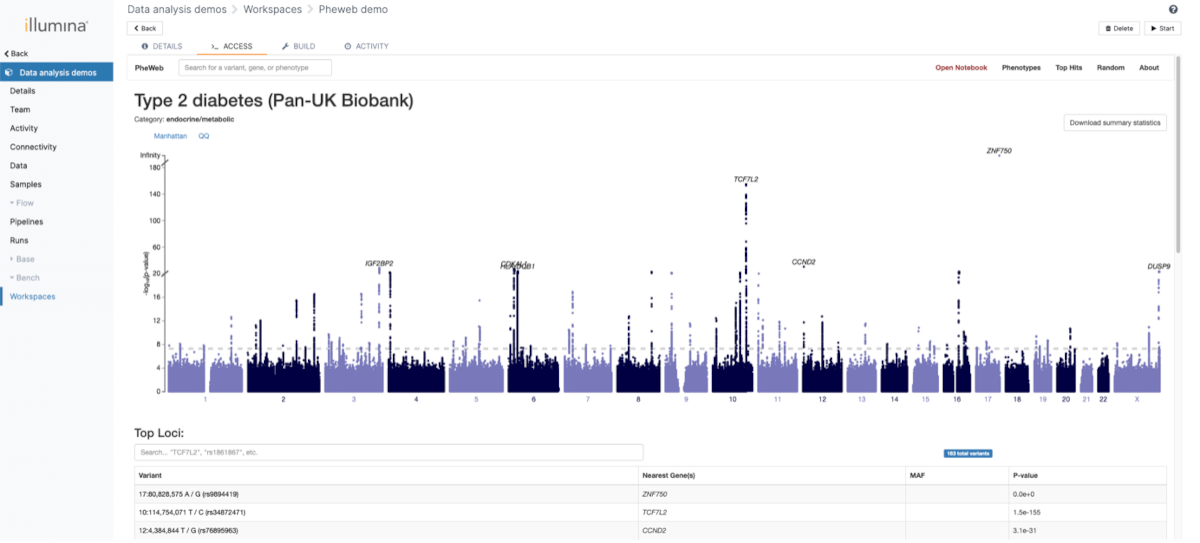
Visualization - PheWeb
One of the main focuses of the GAE was providing multiple possibilities to analyze and visualize the population data. For this purpose, we used the open-source application PheWeb . The visualization is integrated in the complete flow and new results will be processed automatically when they are available.
The categories under which various phenotypes are also customized to allow an easier navigation. An example can be seen in Figure 5.
Discussion and conclusions
Building a complex exploration system can be a daunting task, especially in a field in which the data, tools and understanding evolves as fast as is the case with genomics. Having a good foundation on which to build upon is essential for the success of such a project. So, we can ask: “What part of the platform was essential for the project?” and “What have we learned?”
The answer to the first question, “What part of the platform was essential for the project?”, is the ability to perform any task programmatically (via an API) with the same results to when a human performs the same action in the GUI. This enabled us to build more and more complex processes while at the same time giving freedom to the researchers to still operate with the basic building blocks. Equally important is the ability to manage automatically common, well understood tasks, for example: access control, audit, encryption, backup, infrastructure provisioning, etc. While adjustments are still possible, experience has shown that very good defaults can be already provided such that the actual beneficiaries of the project do not need to change anything.
During this project we have learned that you can efficiently manage large quantities of data and analyze them in reasonable times. One challenge, especially in the case of phenotype data, was harmonizing the existing standards – when available – and enable their convenient use in a research context. Such an use requires combining and linking multiple standards and/or ontologies, across different versions and for different use-cases. While mapping and transforming can be done on a case-by-case basis, having a system like GAE that already provides libraries to do that can significantly boost the research productivity. The evolution of data structure and provided capabilities will continue, because there are still many improvements to be done in harmonizing all the information and build more advanced tools to process it, but this is a process no single entity can do on its own.
References
- UK Biobank https://biobank.ndph.ox.ac.uk/ukb/index.cgi
- Finngen Research Project https://www.finngen.fi/en
- Broad Institute https://pan.ukbb.broadinstitute.org/
- B. L. R. M. e. a. Denny JC Systematic comparison of phenome-wide association study of electronic medical record data and genome-wide association study data Nature Biotechnology vol. Dec, 2013.
- S. V. P. e. a. Gagliano Taliun Exploring and visualizing large-scale genetic associations by using PheWeb Nature Genetics, no. 52, pp. 550-552, 2020.