Introduction
As more labs implement whole-genome sequencing as a clinical test, it becomes increasingly critical to accurately quantify the performance of end-to-end sequencing pipelines. One option is to obtain and sequence reference materials and use them to measure variant calling performance against associated truth data1-3. This allows a lab to accurately measure recall and precision in a large portion (80 - 90%) of the genome. However, these reference materials exist for a limited number of ethnically homogenous samples and do not necessarily predict genome-wide performance in future samples. A complementary approach would be to develop a predictive method that estimates sequencing performance for any sample.
Variant calling can be impacted by both stochastic and systematic variability. For small variants such as single nucleotide variants (SNVs) and short indels, stochastic variability has a very minimal impact on variant calling performance in most of a genome that is sequenced to ≥30x coverage. However, genomic regions that are systematically impacted by lower quality – such as elevated error rates, low mapping quality or depth anomalies — may fail to deliver consistently accurate variant calls even for SNVs and indels. Many of the reference characteristics that cause these systematic errors are well known – e.g., highly repetitive regions have poor mapping quality and homopolymers are known to result in low base accuracy. This knowledge has been used to classify the genome into ‘easy’ and ‘difficult’ regions4. Though these classifications can be helpful, they are not a perfect representation of the actual performance within these regions. For example, a large segmental duplication may be comprised of regions of high and low similarity, leading to very different variant calling accuracy. An improvement over these generic classification methods would be to use actual sequencing data to empirically identify regions of high and low variant calling performance.
Here, we analyzed several sequencing measures related to data quality collected across 29 samples sequenced to an average depth of >50x. Combined, we have an average of 1,450 reads covering every base in the genome, allowing us to identify consistently high-quality regions at base-level resolution and annotate each position as having empirically high or low systematic quality. We then show that these annotations are highly predictive of SNV performance, as measured by pairwise SNV concordance. These empirically derived annotations allow us to improve on frequently used reference-based classification methods. For example, regions that we annotate as high confidence that are within Genome in a Bottle (GIAB) difficult regions have high SNV concordance (Jaccard index = 98.8%) in technical replicates. Conversely, the regions that we annotate as low confidence that are not included in the GIAB difficult regions have low SNV concordance (Jaccard index = 79.9%). Our results demonstrate that by aggregating sequence data from many samples we can identify regions of the genome where small variant calling has systematically high quality.
Methods
To build our database, we selected 29 samples included in the 1000 Genomes Project and obtained from the Coriell Institute Biobank5. These samples represent a range of diverse ethnicities (11 African, 9 East Asian, and 9 European samples). DNA from each sample was prepared using the TruSeq™ PCR-Free Sample Prep Kit and then sequenced with paired-end 150bp reads on a NovaSeq™ 6000 instrument with Xp workflow to an average depth of 51x.
Sequence reads were aligned to GRCh38 with decoy chromosomes but no alternate contigs using Dragen™ v3.4.5. Since we have 29 samples, we expect approximately 1,450 reads per position in the genome. We collected several metrics from the alignment files (BAMs or CRAMs) across all of the samples at each position in the genome including:
- Normalized depth: for each sample, the normalized depth is calculated as each position’s coverage normalized by median autosomal coverage and so a value of 1 corresponds to the median autosomal coverage depth. The normalized depths are averaged across all samples for our final cohort depth.
- Mean mapping quality: the mean mapping quality across all aligned reads across all samples that overlap a genomic position.
- %Q20 basecalls: the percentage of basecalls at a genomic position across all samples with a Phred-scaled quality score exceeding 20, corresponding to an error rate ≤1%.
We measure SNV performance in this analysis using concordance, as calculated using the Jaccard index:

A and B are two sets of variant calls from two variant calling files (VCFs), typically from replicates of the same sample. In the numerator, the intersection of A and B is defined as all variant calls present in both VCFs with identical genotypes. In the denominator, the union of A and B is defined as all variant calls present in either VCF. The Jaccard index of these variant call sets is the intersection of the calls from the sets divided by the union of their calls.
Compared to ground truth resources, some reproducible variants might be due to systematic error, but the results are still highly informative for general performance assessments. For all our analyses, we show the Jaccard index averaged across 30 randomly combined technical replicates of NA12878. The concordance values and number of variants in each class reported are averages of all 30 replicates.
When calculating autosome-wide performance, we exclude Ns and gaps in the reference genome.
Results
Aggregated data provides significant power to detect systematic error trends that may not be detectable within a single sequencing experiment. Consider a site with 40 reads in a genome with 30x median autosomal coverage. If we assume a Poisson distribution of 30x, this will happen due to Poisson sampling at approximately 14 of every 1,000 independent sites. It is therefore difficult to determine whether the higher coverage observed is stochastic or systematic. Conversely, when observing the same site in a population of 30 individuals with 30x coverage, if everyone has exactly 40x coverage at the site, we could be very certain (p=2e-56) that coverage variability at the site is not being driven by stochastic processes. Aggregating high-depth data obtained from many samples allows us to identify systematic anomalies that are most likely to result in poor variant calling performance. In a large set of samples from diverse ethnic backgrounds, common mutations and allele-specific artifacts are identifiable, and if they are sufficiently rare, then they will have limited impact to aggregated summary metrics.
Stratifying the genome by metric performance
Following the procedure outlined in the Methods, we collected three performance metrics (Figure 1).
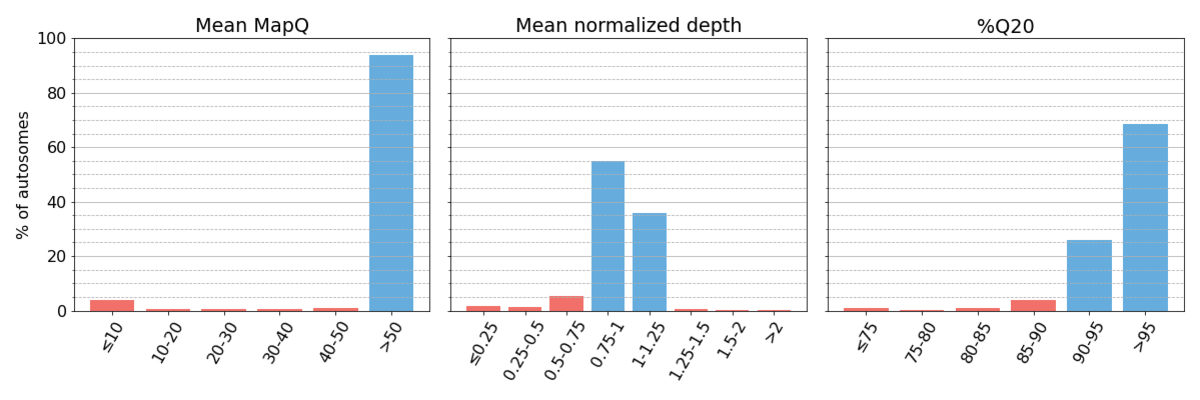
Figure 1: Binned systematic alignment metrics across the entire genome on aggregated sequencing data. Metric bins are half-open. Bins representing high systematic quality are shaded blue, while those representing low systematic quality are shaded red. This is maintained for all figures throughout the article. As described in the text, we define regions as having high systematic quality when they have ≥90% Q20, mean mapping quality ≥50, and mean normalized depth within 25% of targeted coverage.
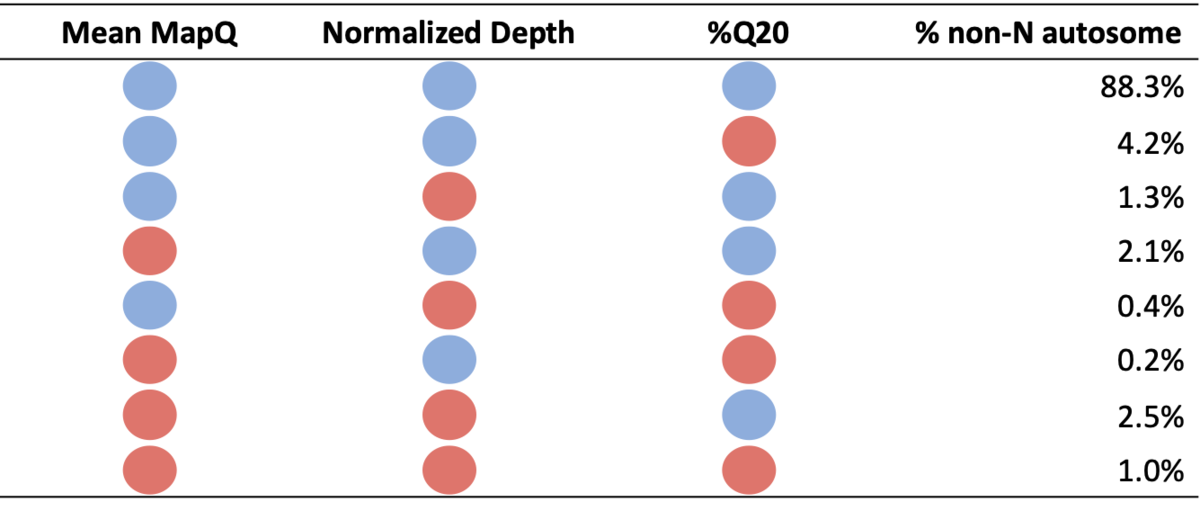
Table 1: Percent of non-N autosome falling into each systematic quality bin. Blue circles denote high systematic quality for a particular metric, while red circles denote low systematic quality.
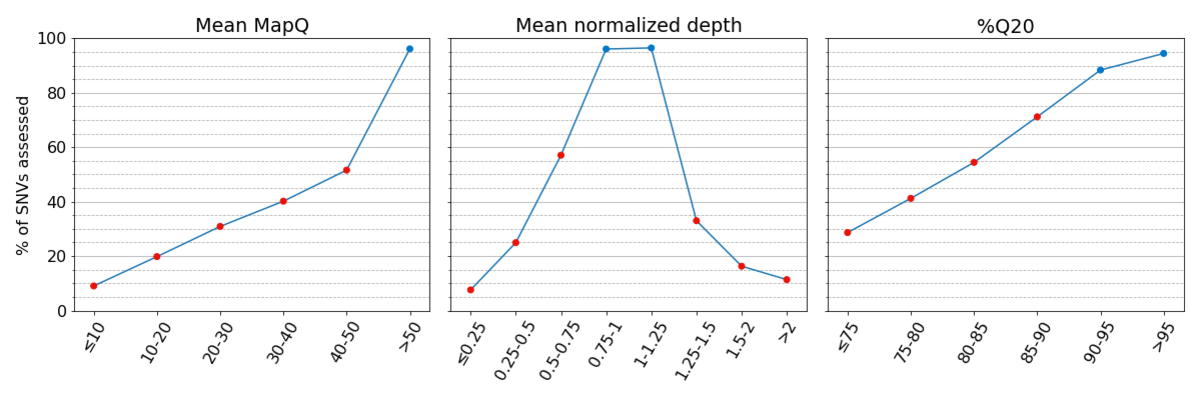
Figure 2: Truthsets have few assessable SNVs in regions with low systematic quality. Percent of assessed SNVs per bin are given for the Platinum Genomes v2017.1 truthset
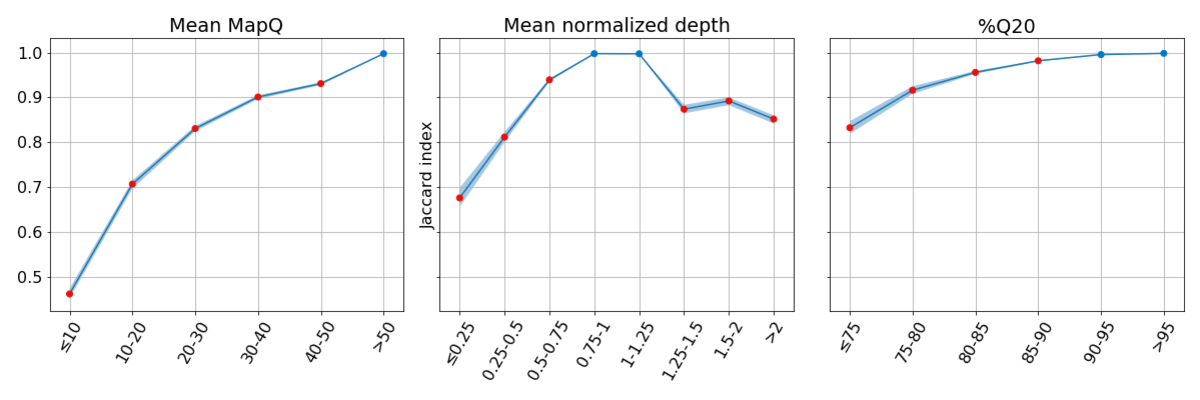
Figure 3: Concordance is poor for regions of the genome with low systematic quality. In each bin, concordance is reported at sites where the other two metrics have high systematic quality, highlighting the impact of low systematic quality for each metric independently.
Comparing empirical systematic quality to Genome in a Bottle difficult regions
While reference features of the genome can negatively influence variant calling performance, variant calling accuracy in these regions is not well-defined. Excluding variants based solely on reference features can eliminate many high-quality variant calls. For example, Genome in a Bottle defines several classes of difficult regions of the genome, including low mappability, segmental duplications, long tandem repeats, and regions with extreme GC content (4). In each of these classes, 18% – 73% of these difficult regions are labeled as high systematic quality in this analysis (Table 2). Concordance is 98.8% for the ~618k SNVs that fall into the ‘difficult’ classes that are determined to have high systematic quality in our analysis. Furthermore, in ~118k SNVs that fall outside of the difficult regions defined by GIAB that have low systematic quality based on our analysis, concordance is 79.9%. Combined, these results indicate that previously described difficult regions are overly broad and that using empirical systematic quality can be a better predictor of germline variant calling performance.
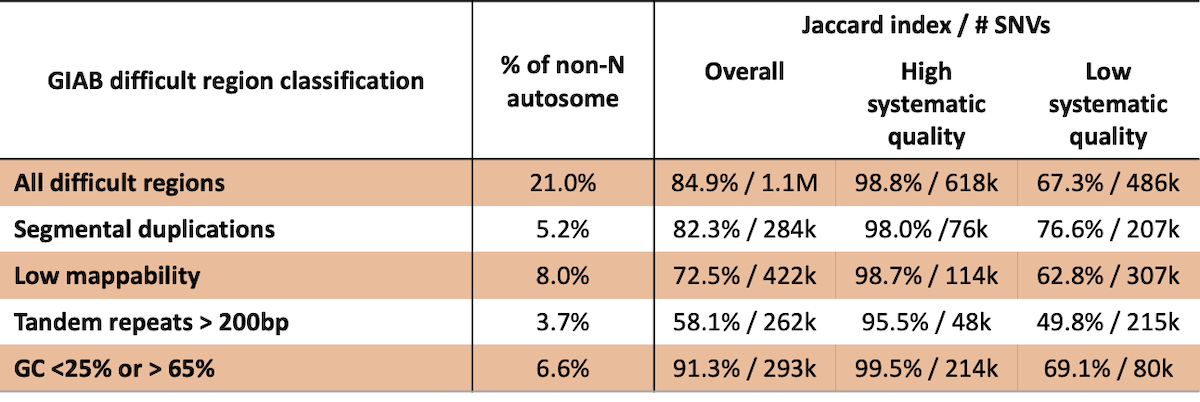
Table 2: GIAB difficult regions are poor predictors of variant calling performance.
Comparing empirical systematic quality to truthset confident regions
Truthset confident region characterization should produce similar, but not identical, regions for high confidence variant calls to those generated from systematic quality binning. Additionally, the confident regions identified for these truthsets can evolve over time even for the same sample. To examine this, we compared the performance for different truthset confident regions based on their overlap with our empirically-defined confident regions (Table 3). Of particular importance, sites that are both within truthset confident regions and have high systematic quality have uniformly high concordance (>99.9%). Likewise, sites with poor systematic quality that are not contained within truthset confident regions have very poor concordance.
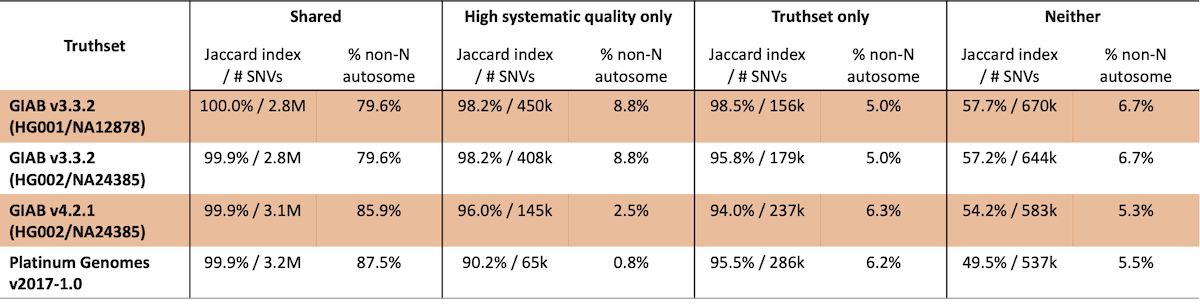
Table 3: SNV concordance for truthsets as compared to regions with high systematic quality
In this analysis, 65k to 450k SNVs are identified that are not present in the truthsets studied, with concordance ranging from ~91% to >98%, indicating that these sites are generally high quality. These observations are consistent with the fact that this analysis is fairly rudimentary – we expect further improvements in concordance for sites with high systematic quality as our methods develop.
These observations lead to two further conclusions. First, given the coarseness of the bins considered here, it is likely that with a more sophisticated analysis, some proportion of these truthset-specific variants may ultimately be classified as having high systematic quality. Some subset of the remaining 12% of the genome is capable of producing variant calls that require orthogonal validation to be considered high confidence. That is exactly what a truthset provides – whether by using pedigree consistency, orthogonal platforms and pipelines, or manual curation, this additional evidence enables high quality calls in more difficult regions of the genome.
Discussion
To successfully drive improvements in the clinical utility of genomic data, it is critical to have a complete understanding of our performance, not just at a broad, genome-wide scale, but at a highly local scale. By aggregating data genome-wide across large populations, we can begin to gain detailed information about our performance in any region of interest. When we see specific impacts to important genes, this information enables us to work on specialized callers that leverage the information available in NGS to deliver clinically actionable results, as demonstrated in Illumina’s bespoke callers for SMA and CYP2D66,7. By breaking down our small variant calling performance, we gain an increasingly clear picture of how systematic errors impact application-specific performance. This suggests future applications that would enable us to understand where we provide reliable clinical results today and maps out where we need to focus our efforts next to improve our clinical genome in the future.
The results presented here suggest that it is possible to develop a universal set of confident regions that focus on features that are predictive of variant calling performance. We demonstrated that within regions of high systematic quality, performance as assessed by pairwise replicate concordance is exceptionally high for SNVs. Importantly, because the regions of high systematic quality were defined on separate samples relative to the assessment set, these results are likely to generalize across any sequenced genome. Currently, this work identified that SNV calls in >88% of the autosomes have a replication rate of ~99.8% indicating that there is little to no need for orthogonal validation within this part of the genome. Continued work is ongoing to better identify high confident regions that cover a larger percent of the genome. Additionally, this work concentrated on SNV concordance, but these same methods can be extended to more complex variant types, as well as to somatic variant calling.
For more information or a DRAGEN trial license for academic use, please contact dragen-info@illumina.com.
References
- Eberle MA, Fritzilas E, et al. A reference data set of 5.4 million phased human variants validated by genetic inheritance from sequencing a three-generation 17-member pedigree. Genome Res. 2017;27(1):157-164. doi:10.1101/gr.210500.116
- Wagner J, Olson ND, et al. Benchmarking challenging small variants with linked and long reads. bioRxiv. 2020;212712. doi:10.1101/2020.07.24.212712
- Zook JM, McDaniel J, et al. An open resource for accurately benchmarking small variant and reference calls. Nat Biotechnol. 2019;37:561-566. doi:10.1038/s41587-019-0074-6
- Krusche P, Trigg L, et al. Best practices for benchmarking germline small-variant calls in human genomes. Nat Biotechnol. 2019;37:555-560. doi:10.1038/s41587-019-0054-x
- Clarke L, Fairley S, et al. The international Genome sample resource (IGSR): A worldwide collection of genome variation incorporating the 1000 Genomes Project data. Nucleic Acids Res. 2017;45(D1):D854-D859. doi:10.1093/nar/gkw829
- Chen X, Sanchis-Juan A, et al. Spinal muscular atrophy diagnosis and carrier screening from genome sequencing data. Genet Med. 2020;22:945-953. doi:10.1038/s41436-020-0754-0
- Chen X, Shen F, et al. Cyrius: accurate CYP2D6 genotyping using whole-genome sequencing data. Pharmacogenomics J. 2021;21:251-261. doi:10.1038/s41397-020-00205-5