Understanding Illumina quality scores
Learn how sequencing quality scores are calculated, reported, and used to assess base-calling accuracy.
Sequencing quality scores measure the probability that a base is called incorrectly. With sequencing by synthesis (SBS) chemistry, each base in a read is assigned a quality score by a phred-like algorithm1,2, similar to that originally developed for Sanger sequencing experiments.
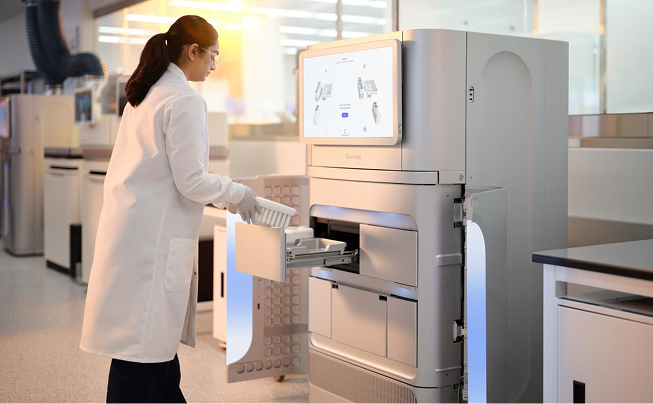
Illumina technology enables massively parallel sequencing with optimized SBS chemistry.
The sequencing quality score of a given base, Q, is defined by the following equation:
Q = −10 log10(e)
Where e is the estimated probability of the base call being wrong.
A quality score of 20 (Q20) represents an error rate of 1 in 100 (meaning every 100 bp sequencing read may contain an error), with a corresponding call accuracy of 99%.
When sequencing quality reaches Q30, virtually all of the reads will be perfect, with no errors or ambiguities. This is why Q30 is considered a benchmark for quality in next-generation sequencing (NGS).
Relationship between sequencing quality scores and base call accuracy
| Quality score | Probability of incorrect base call | Inferred base call accuracy |
|---|---|---|
| 10 (Q10) | 1 in 10 | 90% |
| 20 (Q20) | 1 in 100 | 99% |
| 30 (Q30) | 1 in 1000 | 99.9% |
Quality scores provide an estimate of base-calling accuracy, but they are only one factor that influences sequencing results. Sample quality, library preparation, sequencing chemistry, alignment, and variant calling all contribute to the overall quality of sequencing data. Evaluating results in the context of the full workflow helps ensure confident biological interpretation.

This video breaks down the factors that influence NGS data quality, including sample quality, library preparation, Q scores, and data analysis. Learn how to evaluate sequencing performance, interpret quality metrics, and understand the innovations helping researchers generate high-confidence results.
Illumina sequencing chemistry delivers high accuracy, with a vast majority of bases scoring Q30 and above. This level of accuracy is ideal for a broad range of sequencing applications, from basic research to population studies and more.
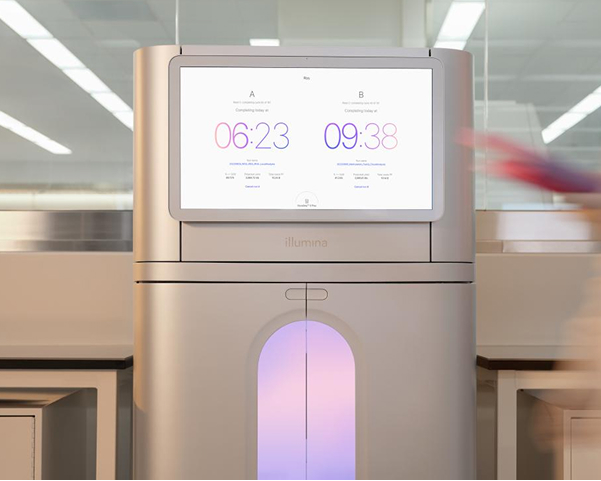
The Illumina sequencing technology roadmap includes planned support for up to Q70 duplex and Q50 simplex quality scores on the NovaSeq X Series, advancing sequencing accuracy to help researchers generate higher-confidence data. As sequencing errors decrease, confidence in detecting rare genomic signals and identifying low-frequency variants increases, supporting highly sensitive research applications, including molecular residual disease (MRD) research. While Q30 remains appropriate for many sequencing applications, higher quality scores can help increase confidence in detecting extremely rare genomic signals in highly sensitive research workflows.
While quality scores do estimate the probability of a base-calling error, they do not offer a complete measure of system or assay accuracy. It is possible to introduce error at any step in the NGS workflow, starting with sample extraction all the way to final data analysis. In addition, because the scores are reported differently by manufacturer and platform, they cannot be used to directly compare platforms from different manufacturers.
Quality scores can be used for quality control (QC) analysis of sequencing runs. They may also be used with variant callers to filter out lower quality data and improve the accuracy and confidence in secondary analysis software such as Illumina DRAGEN secondary analysis.
Explore technical resources for more in-depth information about sequencing quality scores and quality assessment.
Understanding Illumina quality scores
Learn how sequencing quality scores are calculated, reported, and used to assess base-calling accuracy.
NovaSeq 6000 System quality scores and RTA3 software
Explore quality scoring on the NovaSeq 6000 System and how RTA3 software generates and reports sequencing quality metrics.
Learn what PhiX is and how it can be used as an in-run control for sequencing run quality monitoring in Illumina NGS.
Learn how DRAGEN software reports quality metrics across secondary analysis, including mapping, coverage, variant calling, and other pipeline-specific metrics.
Improving germline WGS accuracy with DRAGEN secondary analysis
See how advances in sequencing quality and DRAGEN analysis work together to improve germline whole-genome sequencing variant calling accuracy.
Q40 corresponds to a predicted accuracy of 99.99%, as compared to 99.9% for Q30. Percent Q40+ appears to have little benefit on germline variant calling. However, quality scores of Q40 and above can facilitate research applications that involve detection of ultrarare variants such as molecular residual disease (MRD) research.
Q scores predict accuracy but they do not measure upstream or final assay accuracy. Comparing Q scores across platforms can be misleading unless normalized or interpreted within platform-specific contexts. This is especially true if a manufacturer reports Q scores using proprietary methods and models, or uses technologies with unique, nonstandard base calling methods and quality models.
Q scores comprise a large fraction of the total data storage space. These scores can be compressed into fewer quality bins, without affecting data quality or downstream analysis, such as alignment and variant calling.
Q30 corresponds to a predicted base-call accuracy of 99.9% and has become a widely used benchmark for sequencing quality. Illumina reports the percentage of bases scoring Q30 or above because it provides a practical measure of run performance while aligning with the needs of many sequencing applications.
Q scores help estimate the probability of a base-calling error and provide a measure of confidence for each base in a sequencing read. Secondary analysis tools can use Q scores when processing sequencing data, including filtering lower-quality bases, weighting high-confidence base calls, and supporting alignment and variant-calling workflows. Because Q scores help identify potentially unreliable data, they are also commonly used for sequencing run quality control.
Learn how NGS compares to conventional methods, how the technology works, and what it can do for you.
Seek out a best-in-class NGS company with user-friendly bioinformatics tools and industry-leading support and service.
Learn about read length, coverage, and other experimental considerations to help you plan your sequencing run.
Find next-generation sequencing tutorials designed to help you understand key concepts in NGS.
Cost of next-generation sequencing
See how next-generation sequencing costs have decreased dramatically, and find resources to help you plan your experimental budget.
Compare next-generation sequencing platforms by application, throughput, and other key specifications.
Interested in learning more about quality scores?